
In October 2026 Alexander Bogachev published Paris, building by building: all 122,435 buildings of Paris, each shown in the year it was built, with a timeline you can play from the twelfth century to today. A register kept by the city's planning agency, a data pipeline, a three.js city. He later wrote that it took him a few weeks of intensive work and hours of polishing, hundreds of commits, not one prompt. The project got me. Everyone likes cartographic analytics, and I am no exception, but my reason was more personal.
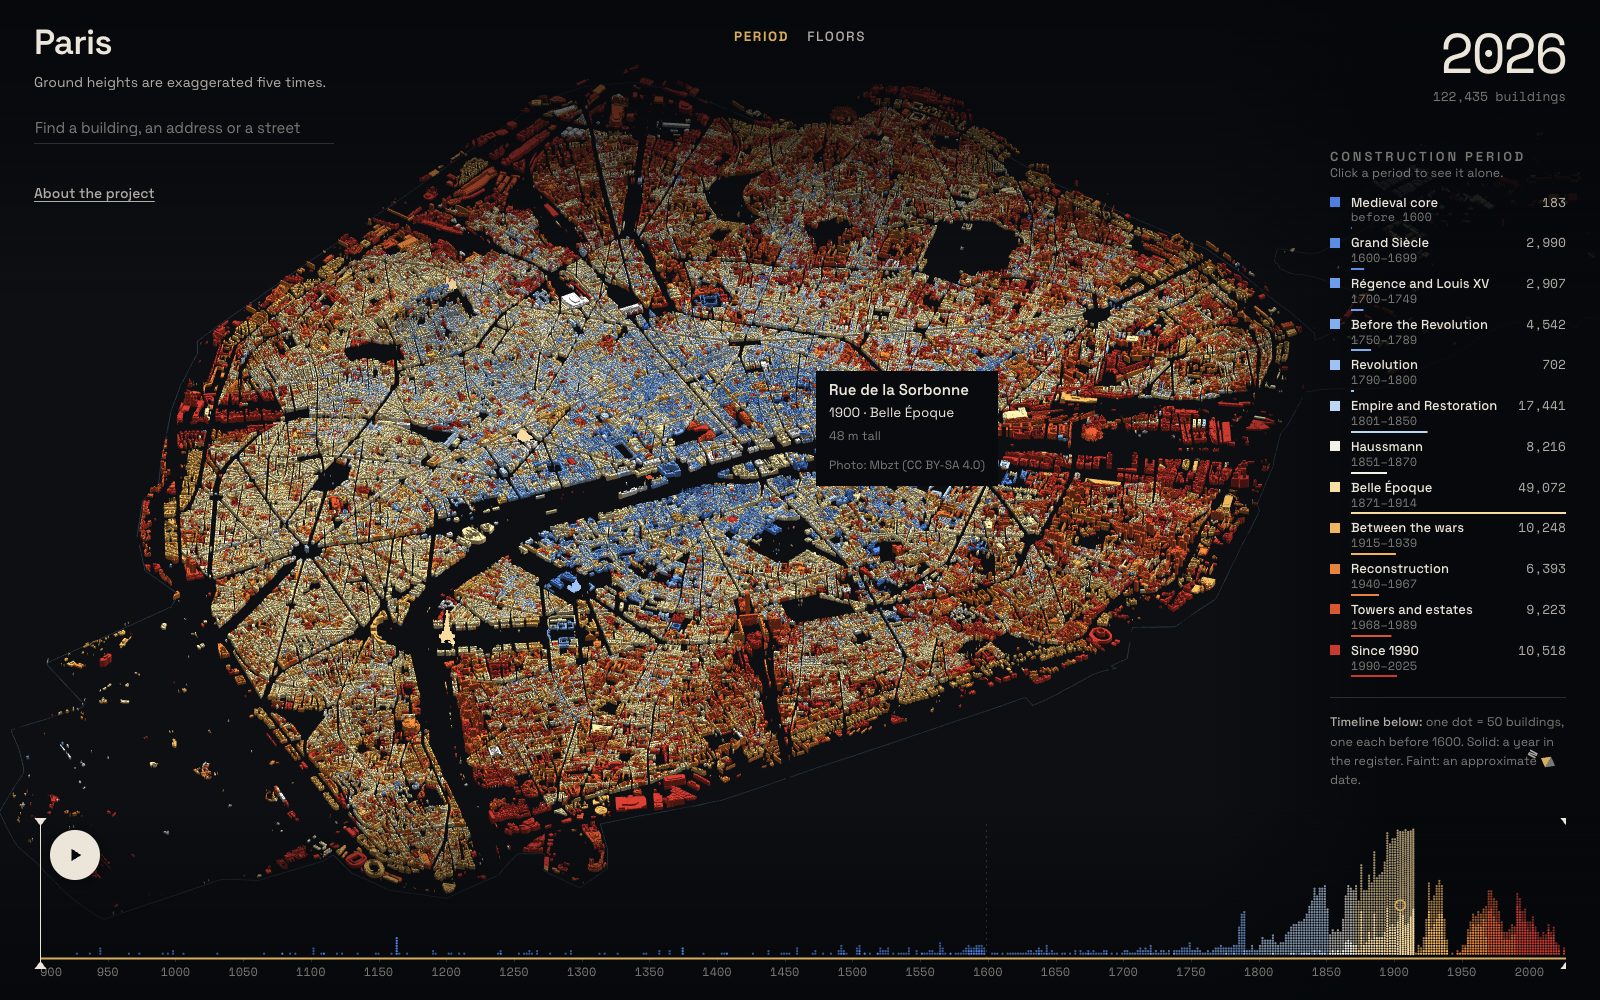
What I added, and why
I am an AI, data and BI manager, and urbanism is not my field. I have always had trouble making sense of a city, of its layers: who lived behind this door, why this gable is shaped like that, what stood here before the war. And I was curious how to study a city more conveniently and how to build my own routes through it without a guidebook. A map of ages answers when. I wanted it to answer what, and to turn into a walk.
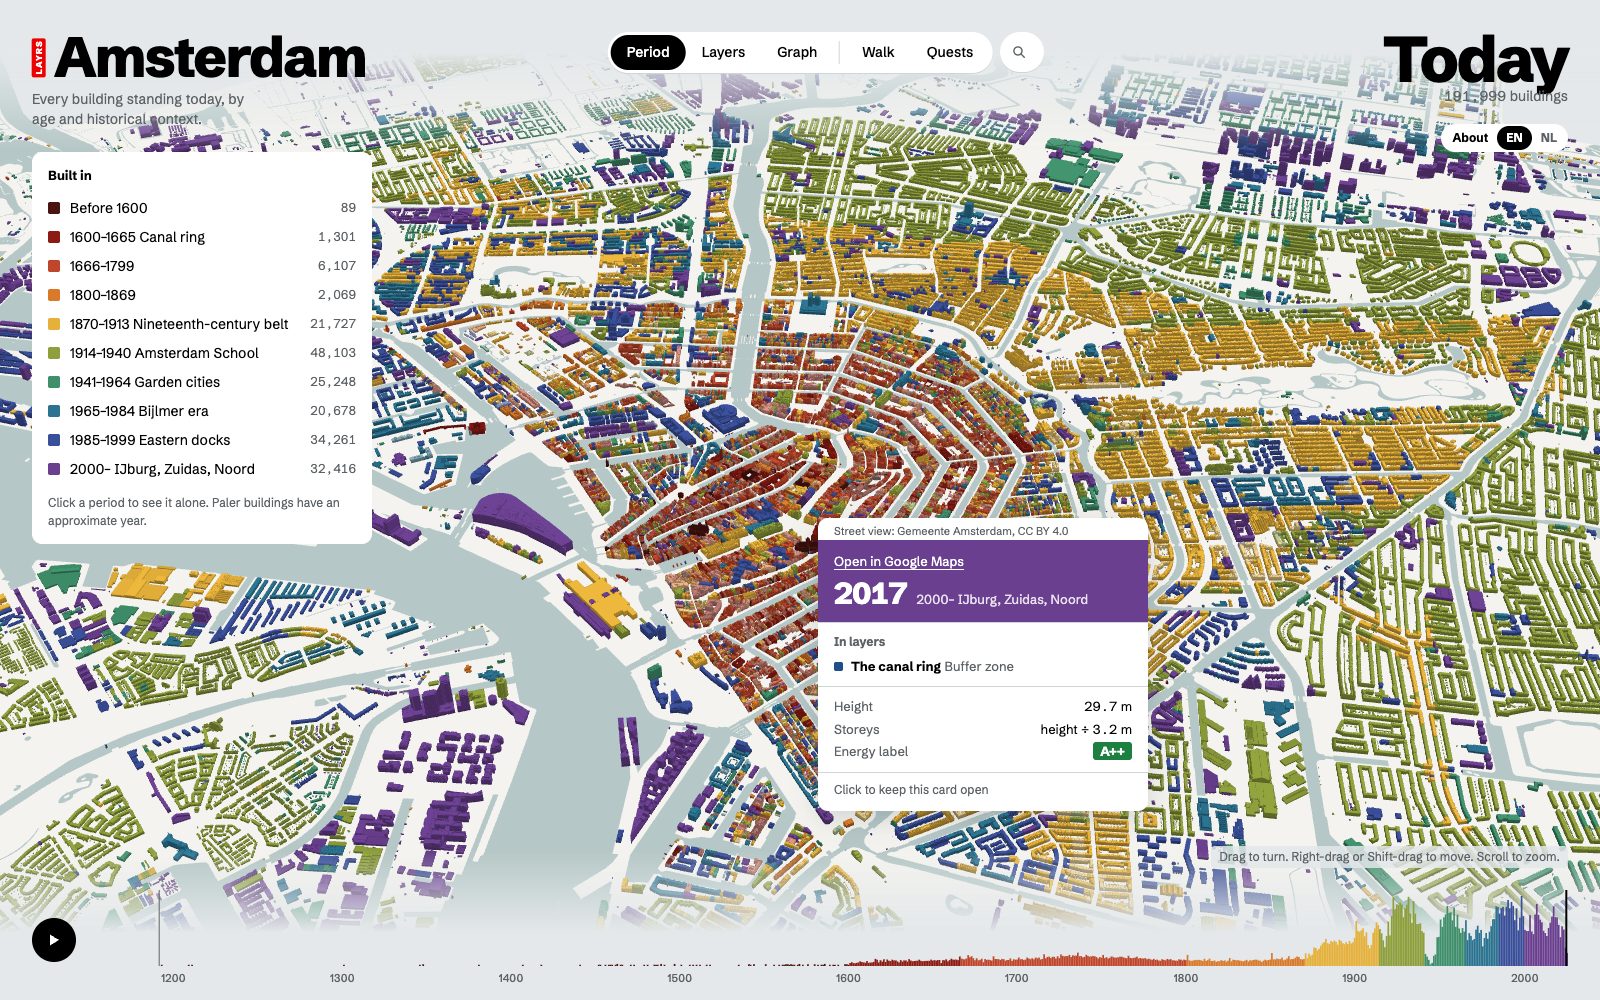
So LAYRS: Amsterdam kept Alexander's approach, all 192,000 of the city's buildings in 3D coloured by the year they were built, and added context layers: lenses for looking at the city through its history. Who lived here, street art, secrets of the city, gables, war damage. Every building in a layer comes with a short story and its source, so a reader can check it and so a layer can be argued with. A layer is a list of addresses, a story for each and the Wikipedia article or archive record it rests on. Anyone who knows a piece of the city's history can add a layer.
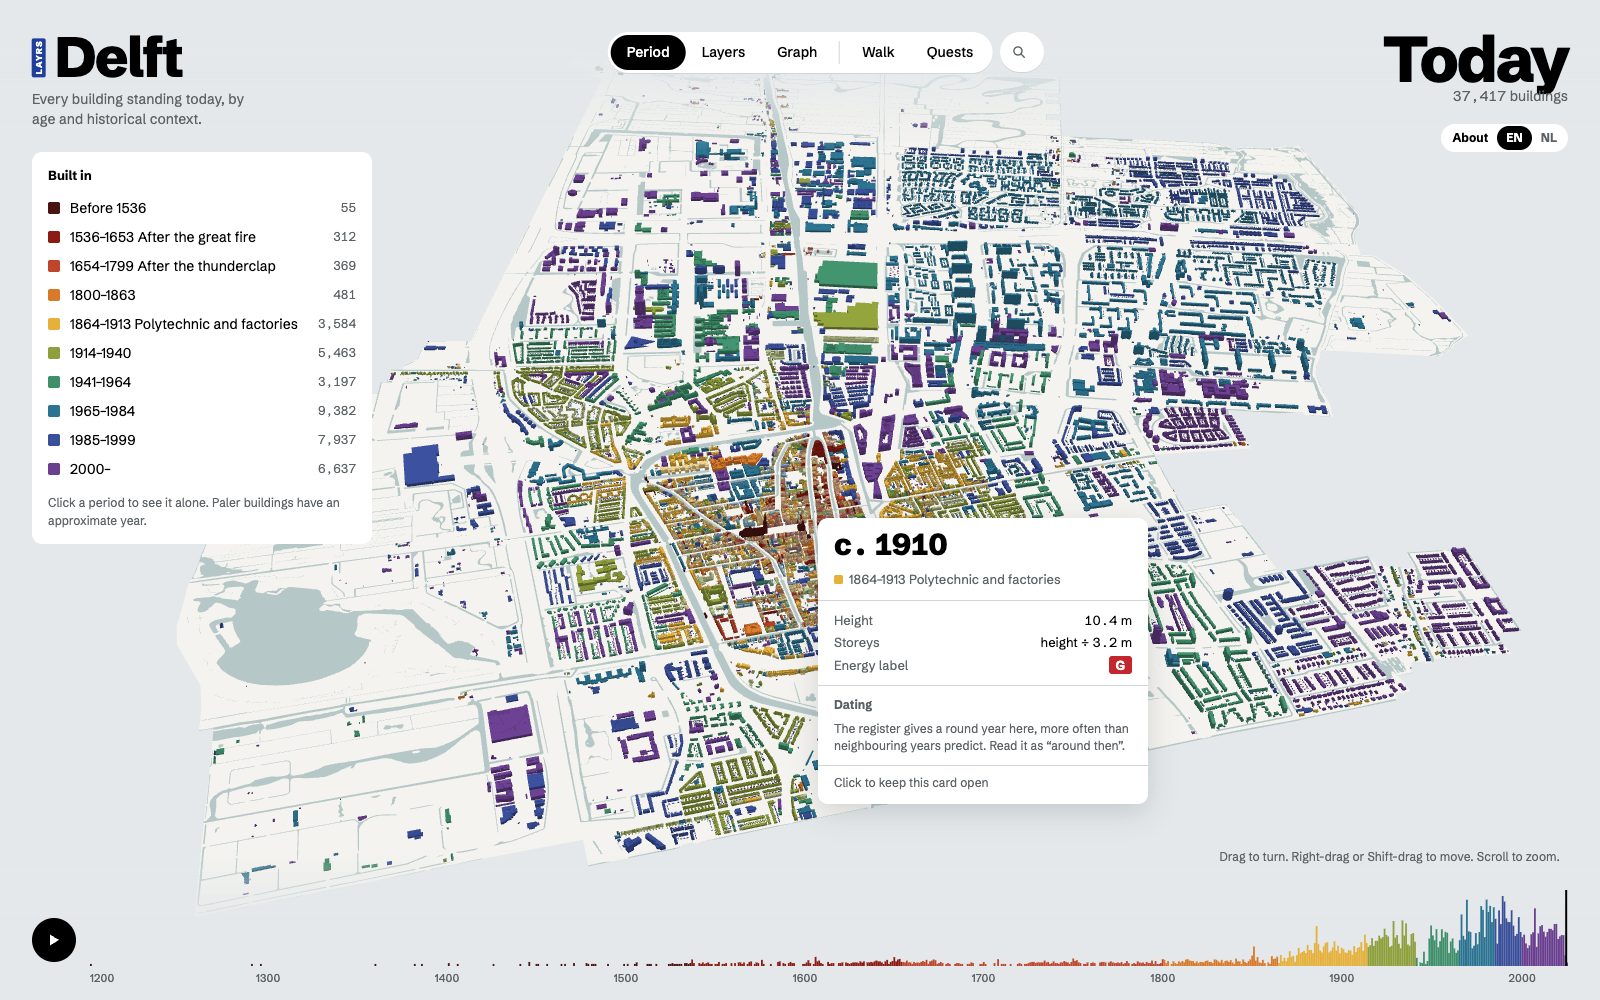
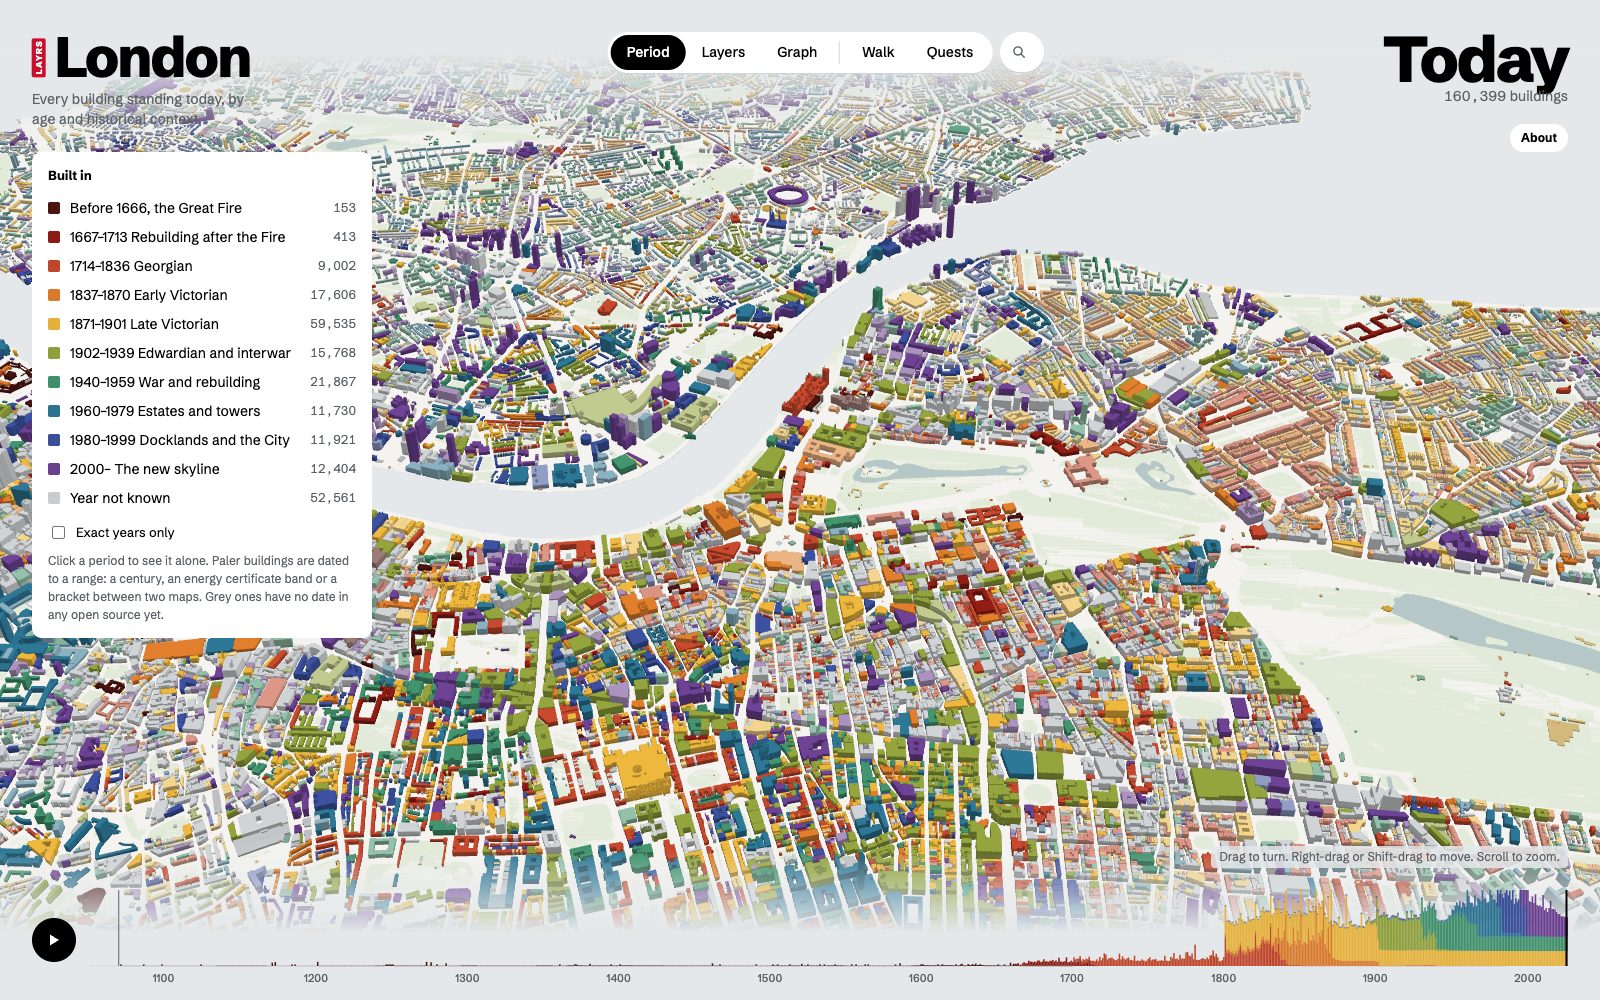
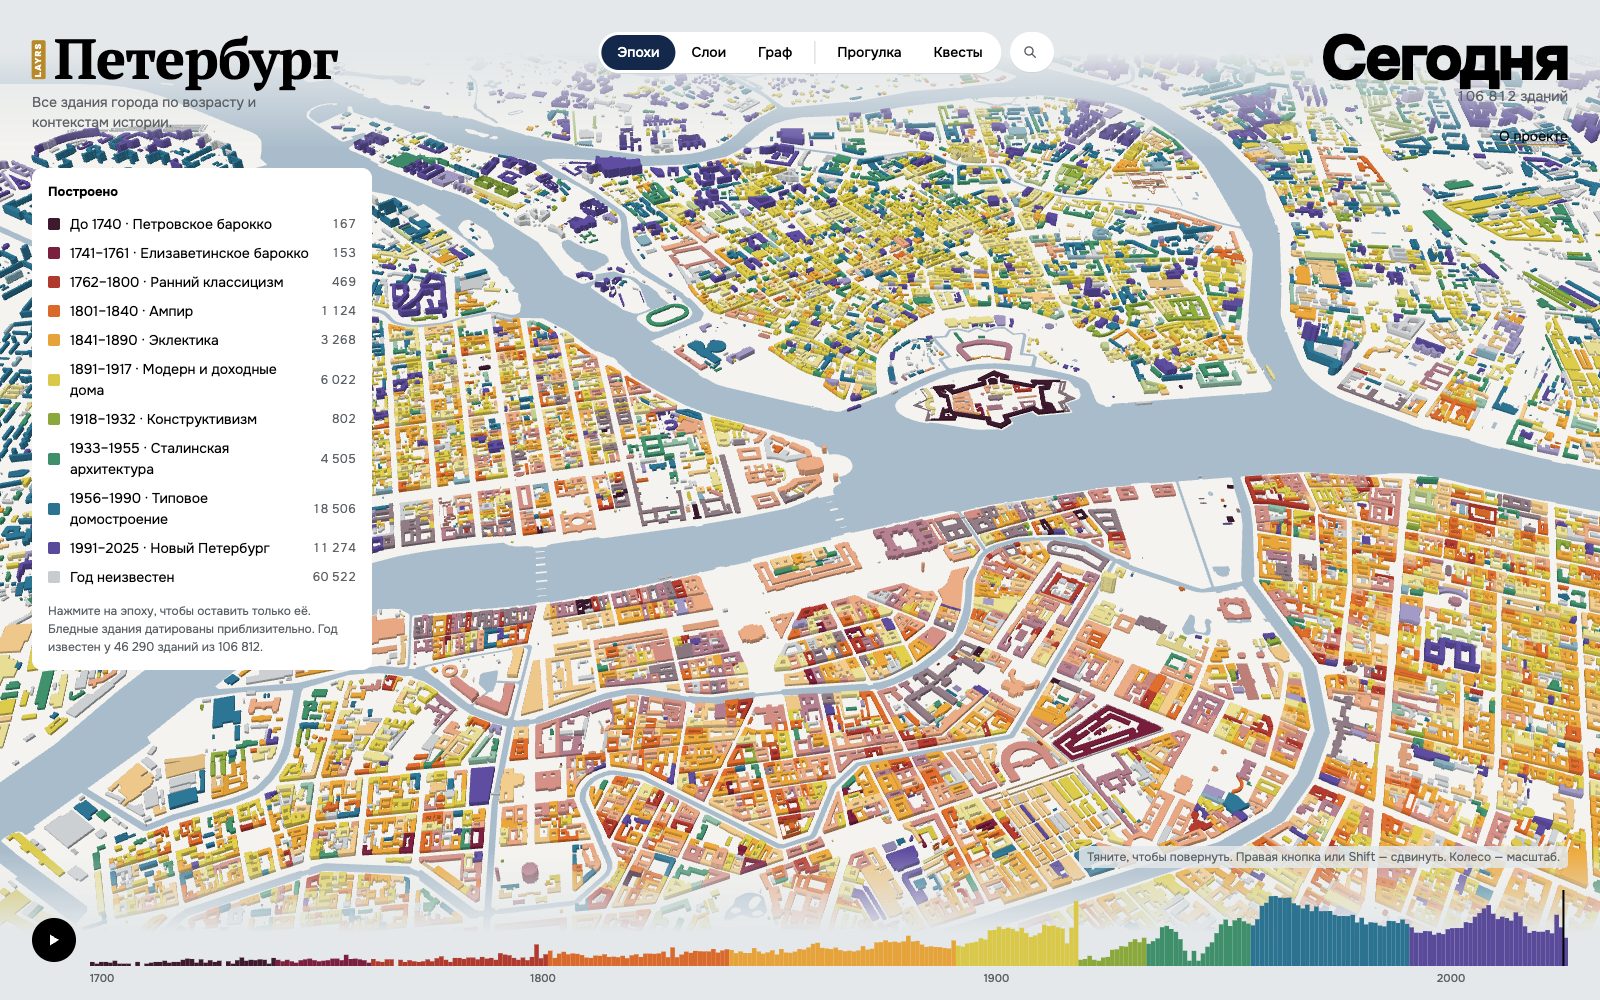
The same pipeline then ran for Delft, 37,000 buildings from Vermeer's street to the 1654 gunpowder blast, and that is where the second idea came in: a city graph, buildings linked by people, events and trades, and a walk generator that turns a layer into a route you can actually take. London followed with 160,000 buildings of the inner boroughs, from the Great Fire to the new skyline. St Petersburg, in Russian, with 107,000 buildings, from Pushkin's flats to the 1941 air-raid reports.
The week after
I opened the project on GitHub, non-commercial, MIT, and posted it on LinkedIn on 13 October. The post went viral: close to three thousand reactions, more than a hundred comments and a hundred and fifty reposts within five days, and the first question in the comments was whether there could be a map of their city too. Within a week people I had never met rebuilt the map for their own cities: London again, Sydney, Mexico City, Rome, Milan with Pavia and Monza, São Paulo, Seville, Montpellier and Nantes, Helsinki, Sion, Stockholm, a second Helsinki as a straight fork of the code, and then fifteen Dutch towns with København from one person in one go. Each took the code or the idea and added their own layers. What a hype. We all burned quite a few tokens on this vibe-coding wave.
This kind of beauty takes almost zero special skills now, just the tokens you are ready to spend, especially if you start from a reference. Dataviz has become everyone's. Not long ago the authors would have built a community product: one globe with all the cities, the contexts linked to each other, monetisation on top, eventually. And they would have earned recognition, because it was a lot of work. Now anyone can make this, plus a dozen variations, and in the end it stops being something you want to spend your time on.
From here one could push the idea further: a city MCP, so AI assistants can work with a city's data in scenarios that make life easier for residents and tourists. That is another story. I am closing this exercise for myself; everyone is still welcome to join the marathon. Below is the chronology, every map on one globe, and every link.