
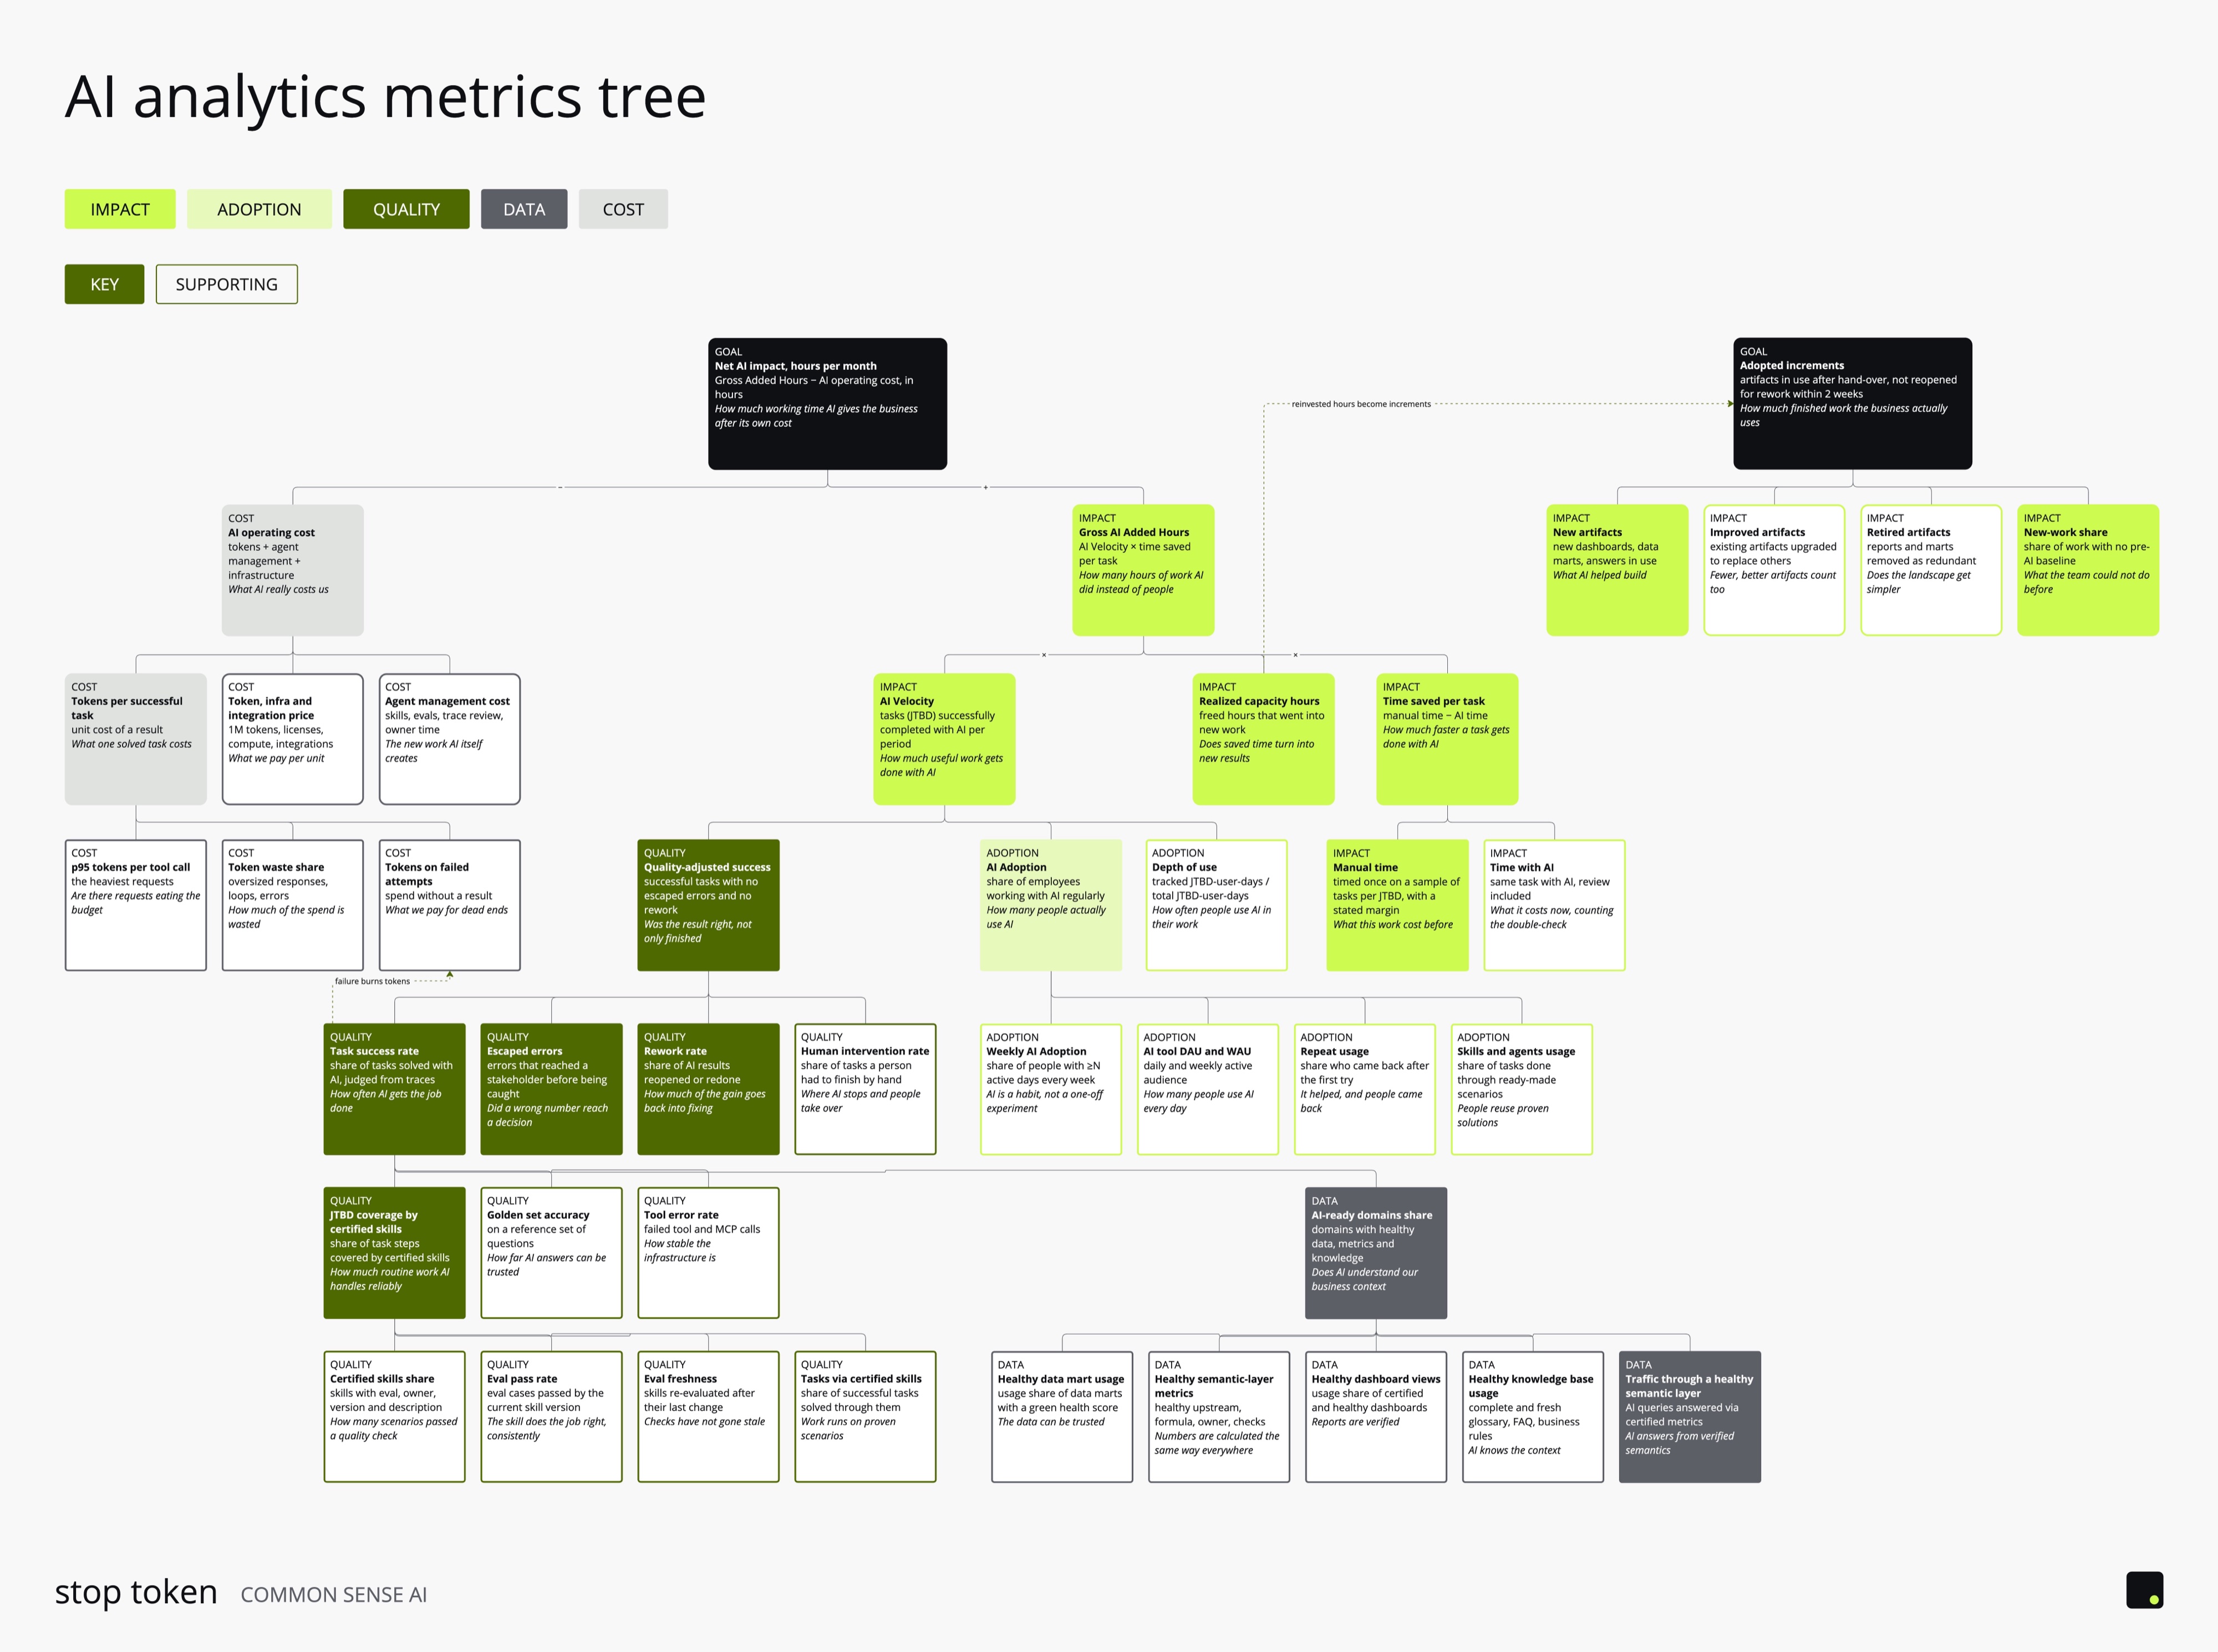
1. The root
At the top is one metric: how many hours a month AI adds, net of what it costs.
Net Added Hours = Gross Added Hours − AI operating cost, converted to hours
Gross Added Hours = AI Velocity × time saved per task
- AI Velocity: the number of tasks solved successfully with AI over a period;
- time saved per task: manual time minus time with AI, review included.
On the first iteration a metric like this runs into a sensitive topic. Converting hours to FTE pushes the conversation towards cutting headcount, and the numbers are not ready for that. Hours that were mined are not yet released headcount.
There is a separate branch, Realized capacity hours: the hours that went into new work. The question is how to count reinvested time. There is no good answer.
Almost nobody has measured manual time on typical tasks (JTBD, jobs to be done); there are only expert estimates. Without that measurement Added Hours stays a rough number. My working answer: time a small sample of recurring tasks of each type once, and state the margin of error.
2. AI Velocity
I split it into three parts:
- AI Adoption: the share of people who use AI regularly (at least N active days in every week);
- tasks per active user;
- Quality-adjusted success: the share of tasks brought to a correct result.
Success judged from traces says the task was finished. It does not say the answer was right. So the success rate sits under a quality layer: tasks with no errors that reached a stakeholder and no rework. Next to the success rate are three more metrics: errors that reached a stakeholder, the share of results reopened or redone, and the share of tasks a person had to finish by hand.
Almost everyone has AI adoption dashboards: DAU, WAU, number of calls, tokens. These numbers grow. They cannot tell how much time or money AI gave the business. In my experience the business will not settle for that for long.
BI went through the same thing: dashboard views were counted as success for years. Here, unlike with dashboards, you can see the tasks people solve in sessions and judge whether they succeeded. Adoption stays in the tree, and we move on.
The first two parts grow with training, promotion and hackathons. Success rate depends on the quality of skills, tools and data. Raise reach while the success rate is low, and the amount of rework grows with it.
3. JTBD coverage by certified skills
An agent's skill needs the same governance as a data mart or a dashboard: an owner, a version, checks, a description. The coverage metric is the share of steps in typical tasks closed by a certified skill. Certified means:
- there is an eval set, an owner, a version and a description;
- the current version passes the eval (pass rate);
- the eval was run after the skill last changed (freshness).
Next to it you need the share of successful tasks that went through certified skills. Otherwise you end up with a catalog nobody uses. Data catalogs have been there already.
Golden-set accuracy and the tool error rate belong to the same branch. If an MCP tool fails on a noticeable share of calls, the success rate runs into the infrastructure.
4. Data
Text-to-SQL that does not understand the domain works badly; Anthropic's write-up confirmed it. The AI-ready domains branch is about the data the agent answers from:
- the usage share of data marts with a green health score (freshness, DQ, owner, description);
- the share of semantic-layer metrics with a healthy upstream, a formula, an owner and checks;
- the share of views on certified, healthy dashboards;
- the usage share of complete and current context: glossary, FAQ, business rules.
The first thing I look at is the share of AI queries answered through certified semantic-layer metrics. When an agent writes SQL over raw tables every time, it costs more and makes plausible mistakes more often.
Every metric in this branch is about coverage for now. I do not know how to tell useful context from ballast, or a working eval from a formal one. I am counting on traces and golden sets.
5. Cost
Tokens are only the visible part. The branch is AI operating cost: tokens, the work of running agents (skills, evals, checking traces, owners' time), and the price of infrastructure and integrations. Running agents is new work that did not exist before AI, and it belongs on the cost side.
I count tokens per successful task. The total grows with adoption and says little on its own.
- tokens per successful task;
- p95 tokens per tool call, to find tools that pull too much into the context;
- the share of waste: oversized responses, loops, errors;
- tokens on failed attempts.
Failed attempts connect the branches: with a low success rate there are fewer hours at the top and more cost at the bottom.
Fewer tokens can be a problem too. If the agent fetched too little data and a person finished the answer by hand, the cost moved to another branch.
6. The second goal: adopted increments
Next to Net Added Hours the tree has a second goal, Adopted increments: working artifacts people use after hand-over and did not send back for rework within two weeks. Dashboards, data marts, answers to business questions.
The two goals are linked: saved hours are worth something when they are reinvested in new work. Adopted increments show whether that happened.
This is probably the fairest metric in the whole tree. It needs no manual-time baseline, does not depend on who finished the task, AI or a person, and does not get confused with cutting headcount. It counts the result the business received.
It splits into four parts:
- new artifacts in use;
- improved artifacts: an existing dashboard upgraded to replace three reports counts too;
- retired artifacts: reports and data marts removed as redundant;
- the share of new work: work with no pre-AI baseline, which the team could not do before.
Weak spots remain. Artifacts differ in size, and adding a dashboard to an answer in a chat is not correct. AI makes a new dashboard cheaper, and that does not make more of them useful. Counting only artifacts in use, with the two-week rule, removes most of the clutter.
7. Key and supporting metrics
On the picture, filled cards are key metrics and white cards are supporting ones. Start with the key metrics. The supporting ones explain why a key metric moved.
What is not solved
- Measuring manual time. Without it Added Hours is a rough estimate.
- Classifying tasks. To count velocity by JTBD, AI requests have to be matched to JTBD types. From detailed logs this is expensive and depends on access to traces; from MCP calls it comes out too coarse.
- Success. Labelling by AI judges gives average accuracy. It is often unclear how to separate tasks AI solved in the session from tasks a person later finished alone, or dropped.
- Decision quality. The tree measures the analytics work. Whether decisions got better is not in it yet. The closest practical step is a decision log: which action the analysis led to, and on which assumptions.
If AI becomes part of every process, comparing work with and without AI may lose its meaning, and what remains is velocity and adopted increments. Whether that is good, I do not know.
If you measure the effect of AI where you work, write to me about where your tree is built differently. I am especially interested in how you measured manual time.